Currently, I have two different scoring functions: BM25 and the semantic scoring function that comes from our sentence embedding. These scores take very different ranges, but need to be combined to make a final score.
It’s not simply a matter of assigning different weights to these scores. We need to stretch them out to make them align.
I’ve had my prober write a different query every twenty minutes for more than a week now. With that, I have 690 queries. I wrote a script which sent these queries to my latest search server to retrieve the latest 100 results and their scores. That gave 62763 (query, result) pairs. Many of these were only from the semantic side and don’t have BM25 scores. Filtering those out brings us down to 45278 records.
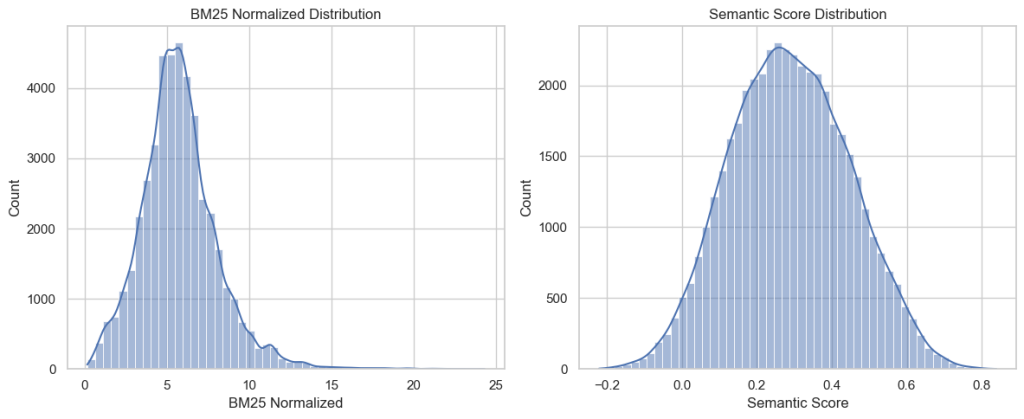
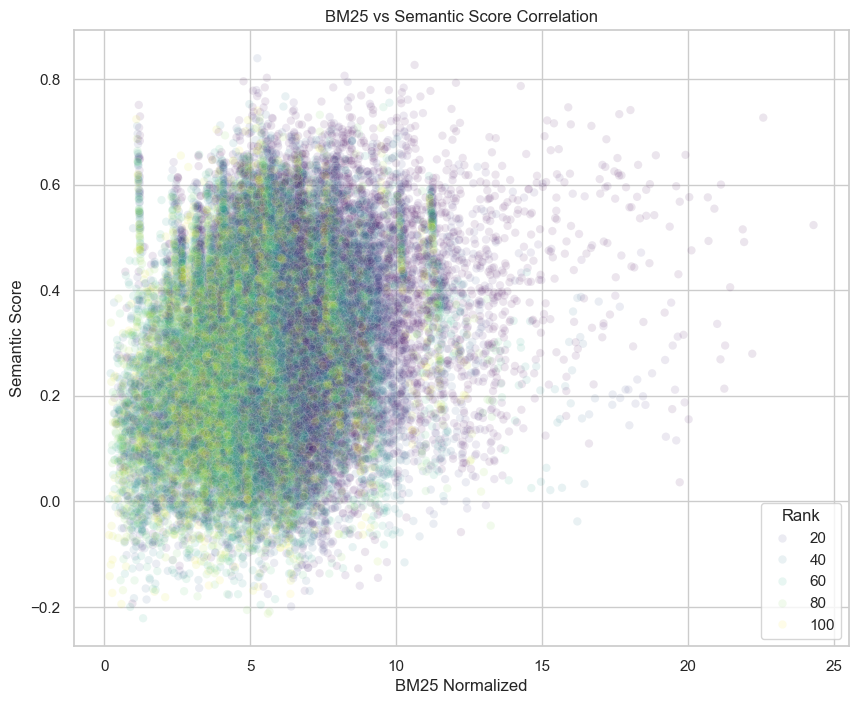
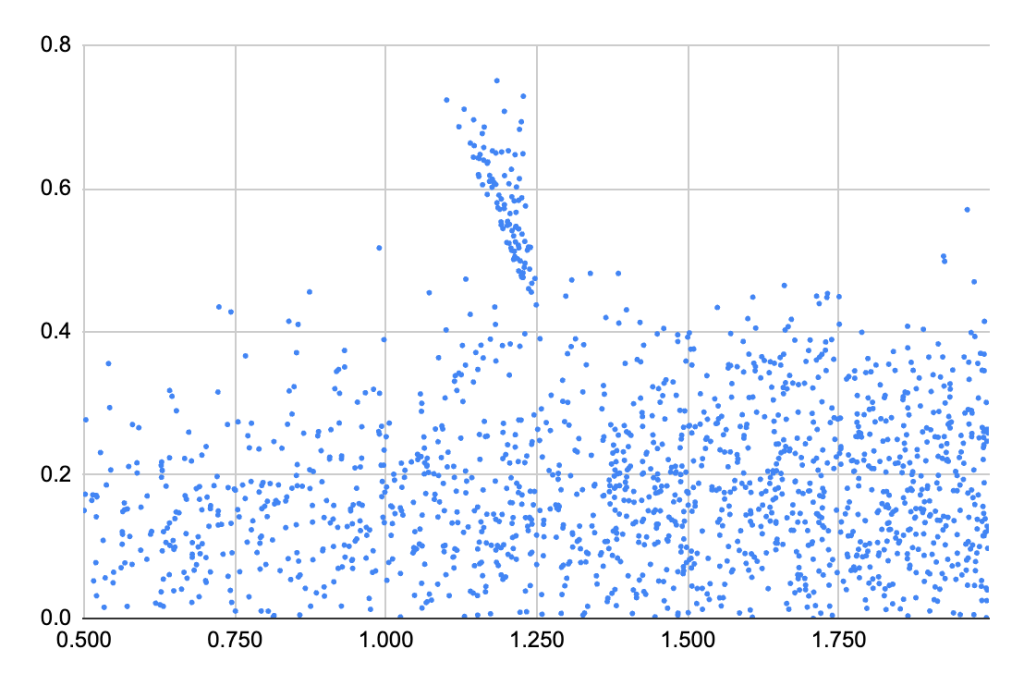
These give a smear of a scatter plot when we plot the semantic and BM25 scores. If these were strongly correlated, then I’d be concerned that they’re both providing the same information and they’d be redundant. If they were completely uncorrelated (which looks more likely) then it would seem they’re not even answering the same question.
You can see that they’re on completely different scales. I decided to normalize the BM25 scores to the same range as the semantic scores and try to minimize the means squared error in the process.
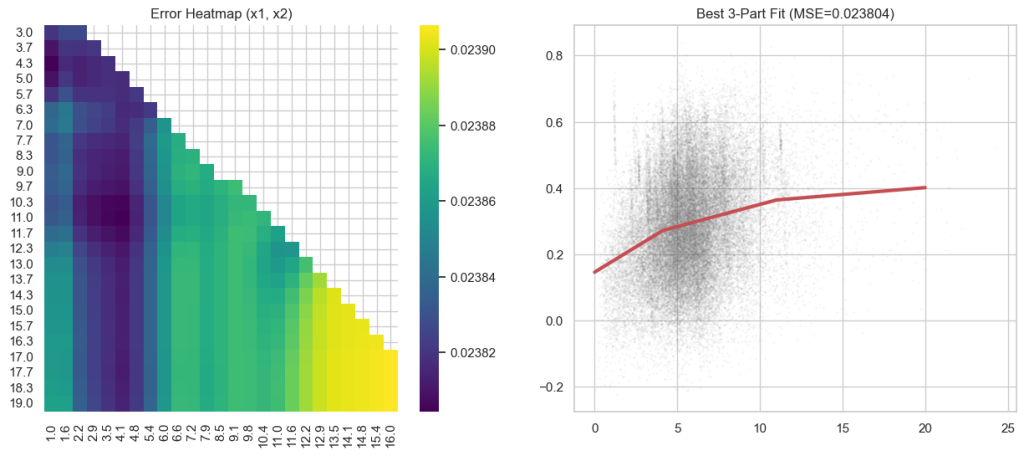
If we chop the domain into equal intervals and minimize the error to a piecewise linear function, we get the following:
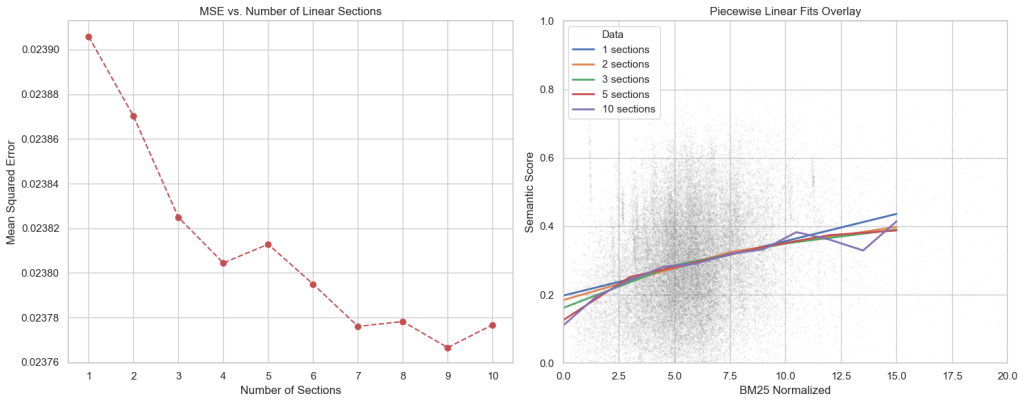
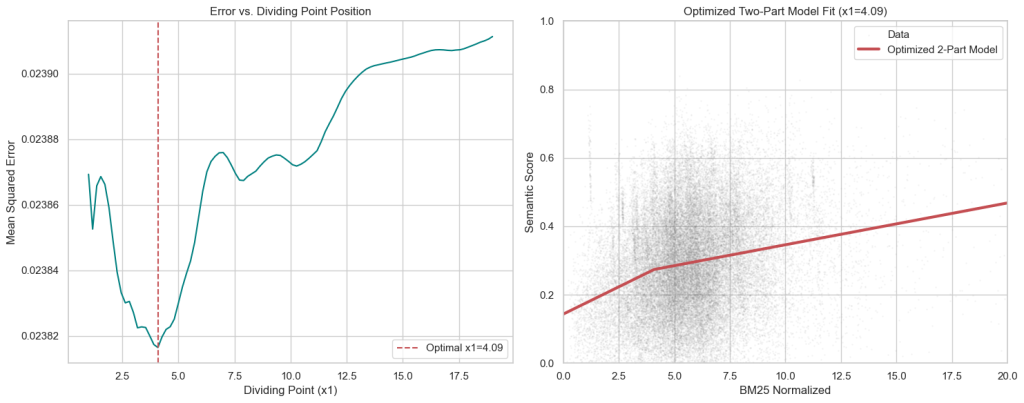
The errors are between 0.02390 and 0.02376. So, there’s not a wide range. More complicated curves don’t fit much better. If we use piecewise linear function with two pieces and minimize where the change in slope is, we find the kink at x=4.0909 and an error of 0.023816.
We can do the same with three pieces and it doesn’t get much better, with error at 0.023804.
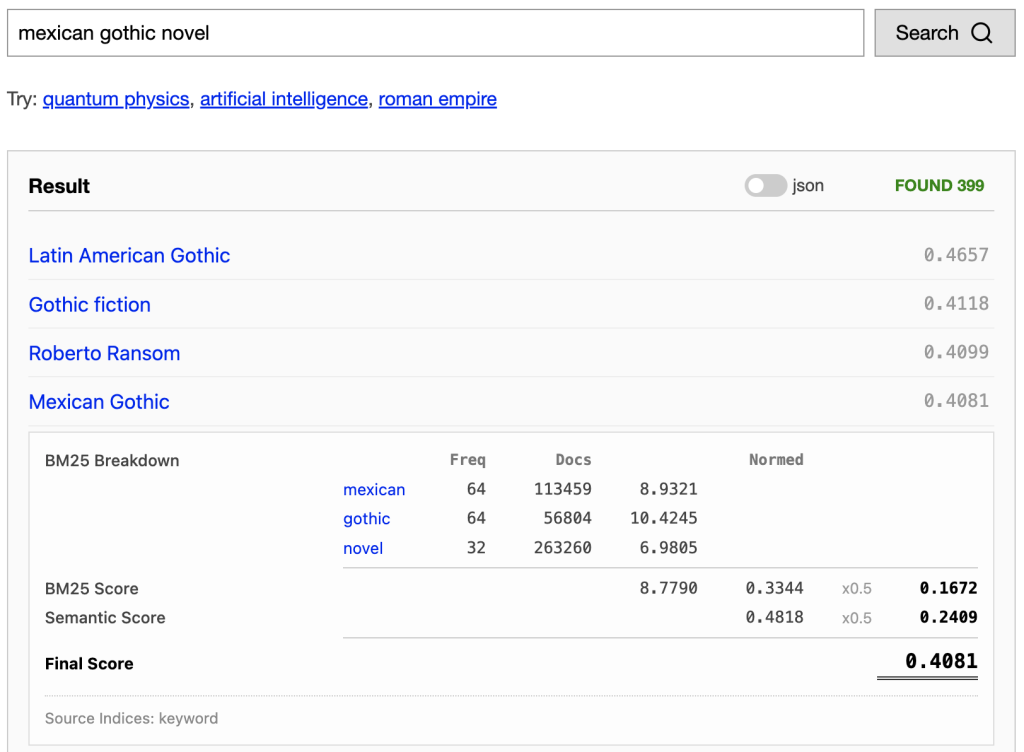
I want a generic library for piecewise linear normalization, so I chose the 3 piece function, and started applying it to the BM25 score before weights. This gives us a fair scoring calculation. The transformed value is in the “Normed” column.
This normalization doesn’t ensure we’re getting the best results. It may be that BM25 provides better results than the semantic score and should be given a heavier weight. Or maybe, there types of queries where one should be favoured over the other. But for now, at least the two scores are comparable.
Coming back to the correlation problem, I ran the numbers and found a Pearson correlation coefficient of 0.227. This is a weak correlation, though there is a discernible trend. Gemini was very reassuring saying “This weak correlation is common in search and information retrieval tasks, where traditional keyword matching (BM25) and modern semantic understanding often capture different aspects of relevance.”
I also did an analysis of the streaks in the upper left of the scatter plot. It came from the results of a single query for “Słowiczkowo history”. This returned no results from the keyword search, because none of the wikipedia documents included the word “Słowiczkowo”. But the retrieved documents from the embedding did have BM25 scores from the word “history”.
Leave a Reply